PSMDB
The Protein - Small-Molecule DataBase
The Protein - Small-Molecule DataBase
Lilien Lab
Department of Computer Science
Centre for Cellular and Biomolecular Research
University of Toronto
Proteins and small-molecules similarity space
The
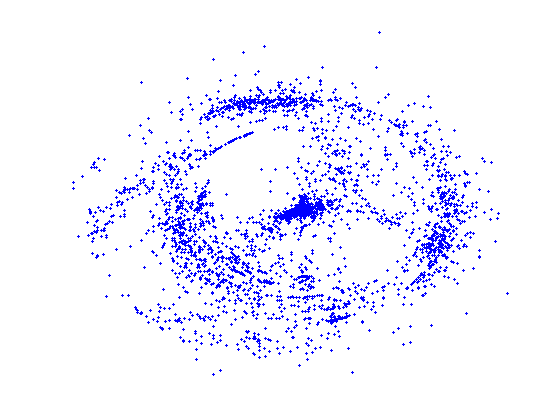
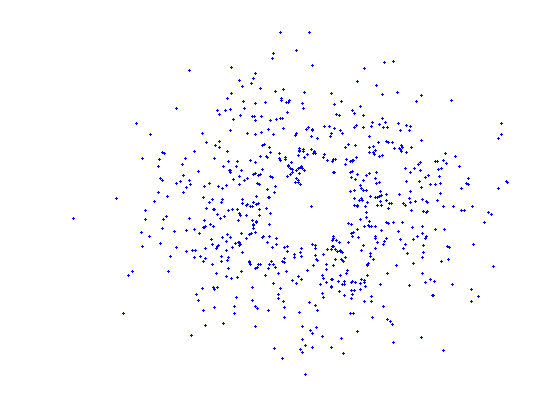
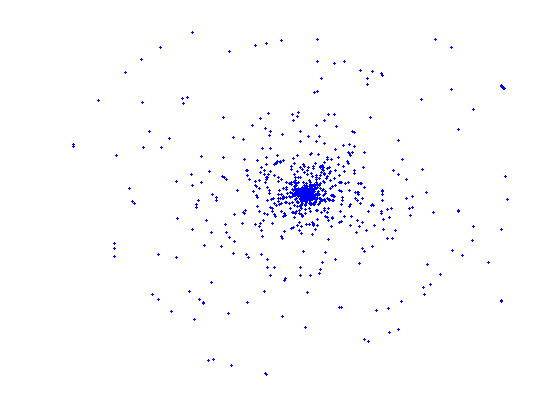
images below demonstrate the similarity distribution of
a subset of proteins (high-resolution, x-ray, complexes) in the PDB.
Each protein is represented with a blue point. The distance between
points reflects sequence similarity. Clumps (clusters) of points
indicate groups of proteins with highly similar sequence. Proteins in a
cluster are predicted to have highly similar structures.
The first image illustrates the distribution of the whole set of protein - small-molecule (high resolution, x-ray) complexes with respect to the protein pair-wise sequence similarity. The second image shows the similarity distribution of the non-redundant set (25% similarity threshold) and the third image shows the similarity distribution of a randomly selected set of similar size. This demonstrates that our selection of non-redundant proteins more evenly represents protein sequence space than a random subset.
1

2
3 3
Images produced using the t-Distributed Stochastic Neighbor Embedding algorithm.
The first image illustrates the distribution of the whole set of protein - small-molecule (high resolution, x-ray) complexes with respect to the protein pair-wise sequence similarity. The second image shows the similarity distribution of the non-redundant set (25% similarity threshold) and the third image shows the similarity distribution of a randomly selected set of similar size. This demonstrates that our selection of non-redundant proteins more evenly represents protein sequence space than a random subset.
1

2

3 3

Images produced using the t-Distributed Stochastic Neighbor Embedding algorithm.